WebGPU Debugging and Errors
Some tips on debugging WebGPU and dealing with errors.
Keep the JavaScript console open to see WebGPU errors
Most browsers have a JavaScript console. Keep it open. WebGPU should generally print errors there.
Consider logging uncaught errors
You can setup an event to catch uncaptured WebGPU errors and then log them yourself. For example
const device = await adapter.requestDevice();
device.addEventListener('uncapturederror', event => alert(event.error.message));
Personally, I generally don’t use alert but you can log the message, put it
an element, or in some way make it visible. I find this useful because I often forget
the advice above, to open the JavaScript console, and then I don’t see the errors. 😅
Errors that WebGPU emits itself go to the JavaScript console but errors that you capture go where you tell them to.
Help WebGPU report errors
Errors in WebGPU are reported asynchronously. This is to keep WebGPU fast and efficient. But, it means sometimes means you might not get an error at the time you expect it or at all, unless you help WebGPU.
Here’s some code using the advice from above, adding an event to show uncaptured errors. It then compiles a shader module that should get an error.
async function main() {
  const adapter = await navigator.gpu?.requestAdapter();
  const device = await adapter?.requestDevice();

  device.addEventListener('uncapturederror', event => {
    log(event.error.message);
  });

  device.createShaderModule({
    code: /* wgsl */ `
      this shader won't compile
    `,
  });

  log('--done--');
}
In the live example below, at least in Chrome 129, you probably won’t get an error.
The reason is, in this case, Chrome in WebGPU doesn’t process certain
errors until you call certain functions. One such function is
submit
async function main() {
  const adapter = await navigator.gpu?.requestAdapter();
  const device = await adapter?.requestDevice();

  device.addEventListener('uncapturederror', event => {
    log(event.error.message);
  });

  device.createShaderModule({
    code: /* wgsl */ `
      this shader won't compile
    `,
  });

+  // pump WebGPU
+  device.queue.submit([]);

  log('--done--');
}
Now it should show the error.
This issue rarely comes up because if you never call submit then you really
aren’t using WebGPU yet. But, it can come up in special situations, like
when you’re trying to make a minimal complete verifiable example for a
tech support question or a bug report. Or if you’re stepping through the
code and you pass a line you know is supposed to cause an error and yet
no error has appeared yet.
Note: If you don’t want the error to also go to the JavaScript
console you can call event.preventDefault()
Manually catching errors.
Above we showed a message for “uncaptured errors” which implies there’s
such a thing as a “captured error”. To capture an error there are a pair
of functions. device.pushErrorScope and device.popErrorScope.
You push an error scope. Submit commands, then pop the error scope to see if there were any errors between the time you pushed and the time you popped.
Example:
  const adapter = await navigator.gpu?.requestAdapter();
  const device = await adapter?.requestDevice();

  device.addEventListener('uncapturederror', event => {
*    log('uncaptured error:', event.error.message);
  });

+  device.pushErrorScope('validation');
  device.createShaderModule({
    code: /* wgsl */ `
      this shader won't compile
    `,
  });
+  const error = await device.popErrorScope();
+  if (error) {
+    log('captured error:', error.message);
+  }

+  device.createShaderModule({
+    code: /* wgsl */ `
+      also, this shader won't compile
+    `,
+  });

  device.queue.submit([]);

  log('--done--');
device.pushErrorScope takes one of three filters.
-
'validation'Errors related to using the API incorrectly
-
'out-of-memory'Errors related to trying to allocate too much memory.
-
'internal'Errors where you did nothing wrong but the driver complained. For example, this might happen if your shader is too complex.
popErrorScope returns a promise with an error or null of there was no error.
Above we use await to wait for the promise, but that stops our program. It’s
probably more common to use then as in:
  device.pushErrorScope('validation');
  device.createShaderModule({
    code: /* wgsl */ `
      this shader won't compile
    `,
  });
+  device.popErrorScope().then(error => {
+    if (error) {
+      log('captured error:', error.message);
+    }
+  });
This way our program doesn’t pause and wait the GPU to get back to us on whether or not there was an error.
Different kinds of Errors
Some errors in WebGPU are checked when you call a function. Others are checked later. WebGPU specifies timelines. Two of them are the “content timeline” and the “device timeline”. The “content timeline” is same timeline as JavaScript itself. The device timeline is separate and generally run in a separate process. Yet other errors are checked by the rules of JavaScript itself.
-
Example of a JavaScript Error: Passing the wrong type
device.queue.writeBuffer(someTexture, ...);
The code above would immediately get an error because the first argument of
writeBuffermust be aGPUBufferwhich JavaScript itself enforces. -
Example of a “content timeline” error
device.createTexture({ size: [], format: 'rgba8unorm', usage: GPUTextureUsage.TEXTURE_BINDING, });sizeas provided above, is an error, it must have at least 1 element. -
Example of a device error
The examples at the start of the page are device errors. Device errors are what
pushErrorScope,popErrorScope, and uncaptured error events process.
Where errors happens is detailed in the spec but it’s important to know that JavaScript errors and content timeline errors happen immediately and throw an exception where as device timeline errors happen asynchronously.
WGSL errors
If you get an error compiling a shader module you can ask for more
detailed info by calling getCompilationInfo.
Example:
  device.pushErrorScope('validation');
  const code = `
      // This function
      // calls a function
      // that does not
      // exist.

      fn foo() -> vec3f {
        return someFunction(1, 2);
      }
    `;
  const module = device.createShaderModule({ code });
  device.popErrorScope().then(async error => {
    if (error) {
      const info = await module.getCompilationInfo();

      // Split the code into lines
      const lines = code.split('\n');

      // Sort the messages by line numbers in reverse order
      // so that as we insert the messages they won't affect
      // the line numbers.
      const msgs = [...info.messages].sort((a, b) => b.lineNum - a.lineNum);

      // Insert the error messages between lines
      for (const msg of msgs) {
        lines.splice(msg.lineNum, 0,
          `${''.padEnd(msg.linePos - 1)}${''.padEnd(msg.length, '^')}`,
          msg.message,
        );
      }

      log(lines.join('\n'));
    }
  });
The code above effectively interleaves any error messages into the full shader code.
getCompilationInfo returns an object that contains an array of
GPUCompilationMessages, each of which has the following fields
message: a string error messagetype:'error'or'warning'or'info'lineNum: the number of the error, 1 basedlinePos: the position in the line of the error, 1 basedoffset: the position in the string of the error, 0 based. (this is effectively the same info as linePos, lineNum)length: the length to highlight
WebGPU-Dev-Extension
The WebGPU-Dev-Extension provides features to help debug.
Some things it can do
-
Show a stack trace where errors happened.
As we showed above, errors in WebGPU happen asynchronously. In the first example we used the
uncapturederrorevent to see that we got a WebGPU error but there was no info about where in JavaScript that error happened.The webgpu-dev-extension provides this info by trying to add calls to
pushErrorScopeandpopErrorScopearound all of the WebGPU functions that generate errors. Inside it creates anErrorobject which holds the a stack trace. If it gets an error it can then print thatErrorobject and you’ll see the error stack of where the error was originally generated. -
Show errors for command encoders
In WebGPU, command encoders, like
GPUCommandEncoder,GPURenderPassEncoder,GPUComputePassEncoder, andGPURenderBundleEncoderdo not generate device timeline errors. Instead, the errors are saved up until you callencoder.finishFor example:
const encoder = device.createCommandEncoder();
const pass = encoder.beginRenderPass(renderPassDesc);
pass.setPipeline(somePipeline);
pass.setBindGroup(0, someBindGroupIncompatibleWithSomePipeline); // oops!
pass.setVertexBuffer(0, positionBuffer);
pass.setVertexBuffer(1, normalBuffer);
pass.setIndexBuffer(indexBuffer, 'uint16');
pass.drawIndexed(4);
pass.end();
const cb = encoder.finish();  // Error above is generated here
The problem here is, at best you’ll get an error message that the bind group bound to group 0 is incompatible with the pipeline but you won’t know which line the error happened on. In a small example like this it should be pretty obvious but in a large app, it might be hard to track down which specific line caused the error.
The webgpu-dev-extension can try to throw an error at the line that caused the error.
-
Show WGSL errors interleaved with the full shader source
Like the example above, the webgpu-dev-extension has an option to show the errors interleaved with the source WGSL, rather than just a terse error message. (the default)
-
Checks if you updated a buffer or texture more than once per submit. See below for what that means.
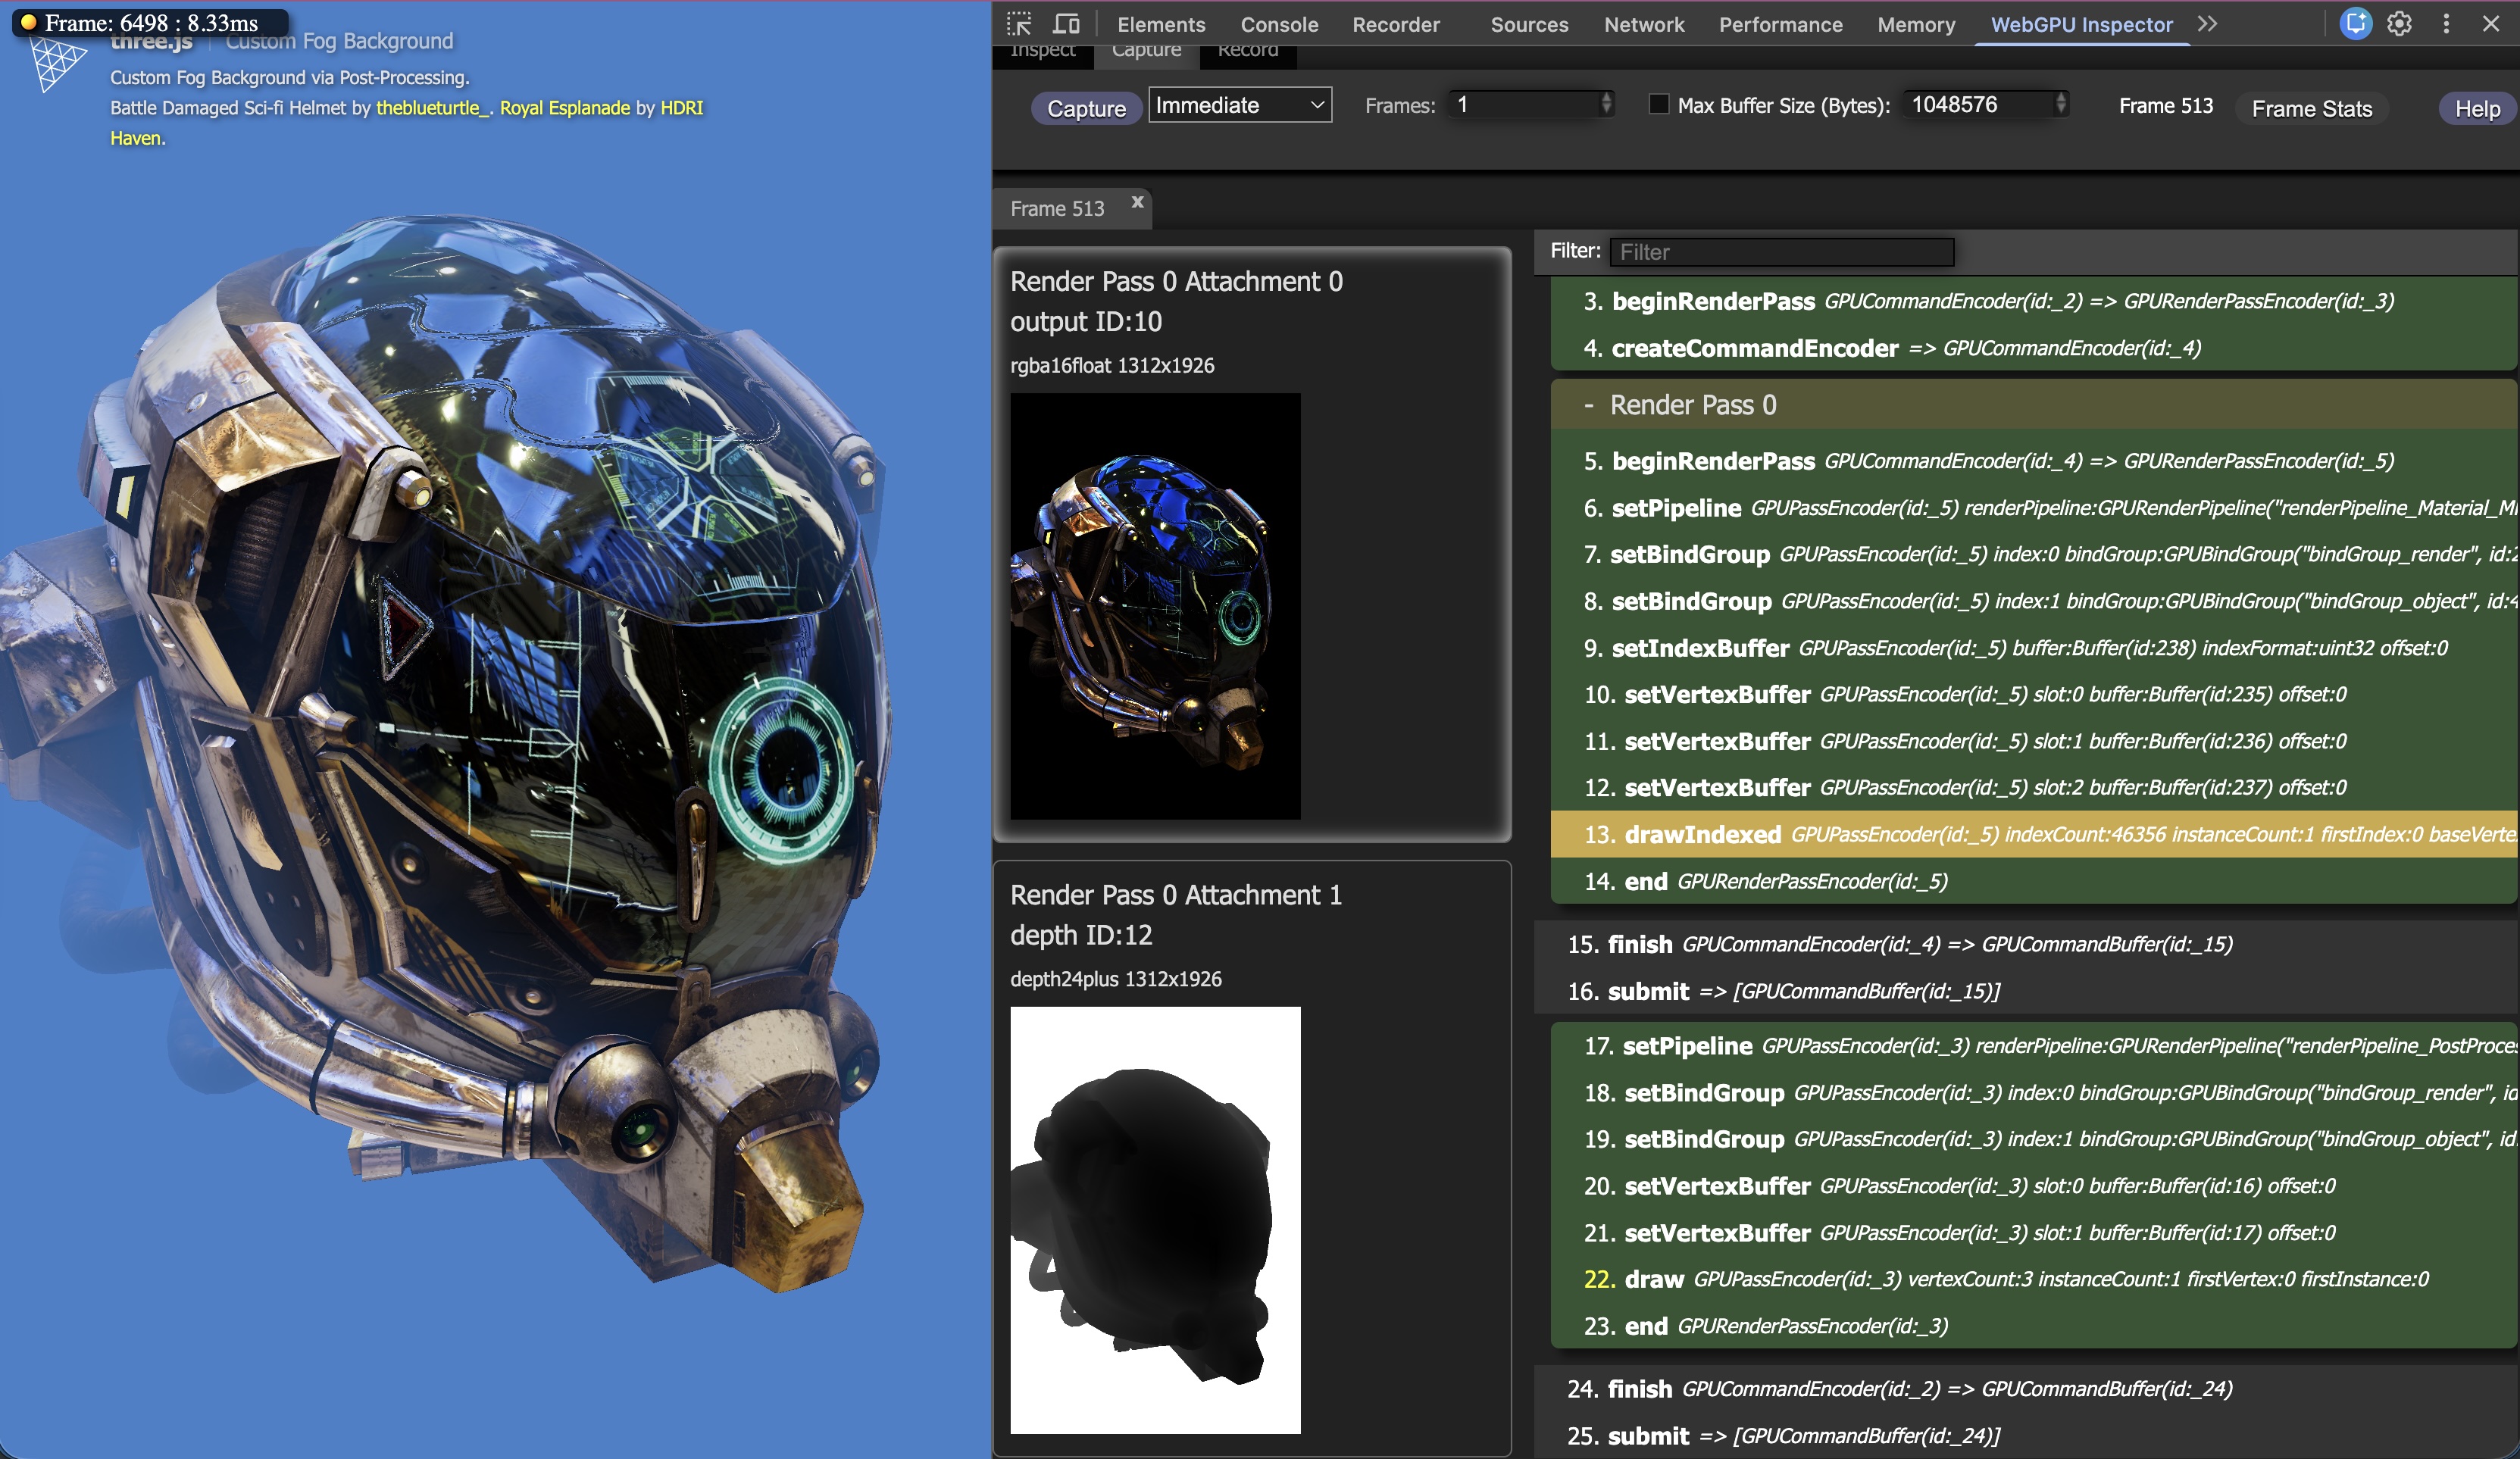
WebGPU-Inspector
The WebGPU-Inspector will attempt to capture all of your WebGPU commands and can let you inspect buffers, textures, calls, and generally try to see what’s happening in your WebGPU code.
Tips for debugging shaders
Simplify:
Get your shader to a working state by cutting out as much as possible. Once it’s working, add stuff back in little by little
Show a solid color
For render passes, the first thing I often do is show a solid color.
Here is last shader from the article on spot lights.
@fragment fn fs(vsOut: VSOutput) -> @location(0) vec4f {
  // Because vsOut.normal is an inter-stage variable
  // it's interpolated so it will not be a unit vector.
  // Normalizing it will make it a unit vector again
  let normal = normalize(vsOut.normal);

  let surfaceToLightDirection = normalize(vsOut.surfaceToLight);
  let surfaceToViewDirection = normalize(vsOut.surfaceToView);
  let halfVector = normalize(
    surfaceToLightDirection + surfaceToViewDirection);

  let dotFromDirection = dot(surfaceToLightDirection, -uni.lightDirection);
  let inLight = smoothstep(uni.outerLimit, uni.innerLimit, dotFromDirection);

  // Compute the light by taking the dot product
  // of the normal with the direction to the light
  let light = inLight * dot(normal, surfaceToLightDirection);

  var specular = dot(normal, halfVector);
  specular = inLight * select(
      0.0,                           // value if condition false
      pow(specular, uni.shininess),  // value if condition is true
      specular > 0.0);               // condition

  // Lets multiply just the color portion (not the alpha)
  // by the light
  let color = uni.color.rgb * light + specular;
  return vec4f(color, uni.color.a);
}
The example is supposed to render a green F with a small portion lit by a spotlight. Here’s a version with a bug. Let’s debug it.
We ran it and nothing appeared on the screen and there were no WebGPU errors. The first thing I might do is change it to return solid red
  let color = uni.color.rgb * light + specular;
-  return vec4f(color, uni.color.a);
+  //return vec4f(color, uni.color.a);
+  return vec4f(1, 0, 0, 1);  // solid red
If I see a red F then I know I should start looking in the fragment shader since clearly enough of the vertex shader was correct to draw the triangles that make the F. If I don’t see a red F then I should start looking in the vertex shader.
Trying it:
We see a red F. Ok, lets try to visualize the normals. To do so, change the end of the fragment shader to:
  let color = uni.color.rgb * light + specular;
  //return vec4f(color, uni.color.a);
-   return vec4f(1, 0, 0, 1);  // solid red
+   //return vec4f(1, 0, 0, 1);  // solid red
+   return vec4f(vsOut.normal * 0.5 + 0.5, 1);  // normal
Normals go from -1.0 to +1.0 but colors go from 0.0 to 1.0 so by multiplying by 0.5 and adding 0.5 we convert the normals to something that can be visualized with colors.
Trying that:
Hmmm, that’s not right. That looks suspiciously like all the normals are 0,0,0.
Clearly something is wrong the normals in the fragment shader. Those normals
come from the vertex shader after being multiplied by normalMatrix. Let’s try
passing the normals straight through, without multiplying by normalMatrix. If
the F appears then we know the bug is in normalMatrix. If the F doesn’t appear
then the bug in the data being supplied to the vertex shader.
  // Orient the normals and pass to the fragment shader
-  vsOut.normal = uni.normalMatrix * vert.normal;
+  //vsOut.normal = uni.normalMatrix * vert.normal;
+  vsOut.normal = vert.normal;
Running that:
That looks more like it. So apparently something is wrong with
normalMatrix
Checking the code it was commented out which left the matrix all zeros. Someone must have checking something and forgot to uncomment it.😅
    // Inverse and transpose it into the worldInverseTranspose value
-    //mat3.fromMat4(mat4.transpose(mat4.inverse(world)), normalMatrixValue);
+    mat3.fromMat4(mat4.transpose(mat4.inverse(world)), normalMatrixValue);
Let’s un-comment it. Then let’s put the vertex shader back the way it was
  // Orient the normals and pass to the fragment shader
-  //vsOut.normal = uni.normalMatrix * vert.normal;
-  vsOut.normal = vert.normal;
+  vsOut.normal = uni.normalMatrix * vert.normal;
That gives us:
If you rotate the F you’ll see the colors change showing the normals
are being re-oriented by normalMatrix. Compare that to the one above
where the colors don’t change as we rotate.
With that we can finally restore the fragment shader.
  let color = uni.color.rgb * light + specular;
-  //return vec4f(color, uni.color.a);
-  //return vec4f(1, 0, 0, 1);  // solid red
-  return vec4f(vsOut.normal * 0.5 + 0.5, 1);  // normal
+  return vec4f(color, uni.color.a);
And it’s working as it’s supposed to.
Finding ways to visualize your data is a good way to check it. For example, to check texture coordinates you might do something like
return vec4f(fract(textureCoord), 0, 1);
Texture coordinates generally go from 0.0 to 1.0 but if you’re repeating
the texture they might go higher so fract covers that.
To give an idea of what texture coordinates look like, here’s a few objects with their texture coordinates visualized.
Texture coordinates are generally smooth over some surface.
Here are the same texture coordinates visualized with a bug.
They are no longer smooth so something is probably off.
Following the same procedures as above we’d conclude that the data coming into
the vertex shader must be bad. And indeed, this example is uploading the
vertex data as float32x3 values but mistakenly specified them as float16x2
in the render pipeline descriptor.
Other common issues
Remembering that command buffers don’t execute until you submit them
It’s common to run into a version of this problem
  const encoder = device.createCommandEncoder();
  const pass = encoder.beginRenderPass(renderPassDesc);
  pass.setPipeline(somePipeline);
  pass.setBindGroup(0, someBindGroupThatUsesSomeBuffer);
  device.queue.writeBuffer(someBuffer, 0, data0ForBuffer);
  pass.draw(numVertices);
  device.queue.writeBuffer(someBuffer, 0, data1ForBuffer); // ERROR!?
  pass.draw(numVertices);
  pass.end();
  device.queue.submit([encoder.finish()]);
The code above is updating someBuffer by calling queue.writeBuffer. That function
executes immediately where as the draw function does not execute, it just adds
a command to a command buffer. That command buffer gets executed later.
Usually this type of situation is not as obvious as the code above. It’s more common to call some various functions and have one update a buffer that’s already being used earlier.
One way to find this kind of bug is to use the WebGPU-Inspector which either defaults to, or has an option, to order the commands in the order they will be executed rather then the order they were created in your code. This can be helpful to see what your code is actually doing vs what you thought it was doing.
Another is to use the WebGPU-Dev-Extension
Remembering that Canvas Textures are only valid until the next event
You call someWebGPUContext.getCurrentTexture to get the texture for a canvas.
That texture only exists for the current event. So for example, code like this
will fail
  const texture = context.getCurrentTexture();

  // This ends the current event and waits for another
  await someAsyncFunction();

  // ERROR: The canvas texture no longer exist
  encoder.beginRenderPass({
    colorTarget: { view: texture, ...},
  });
  ...
You need to call getCurrentTexture at the last possible moment and then apply
all uses without async or any other events or callbacks.
External textures expire at the next event
importExternalTexture imports a texture from a video. Like the canvas texture,
the external texture is only valid until the end of the current event.
Waiting for images to load
This issue is not unique to WebGPU but images (and videos) load asynchronously so if you’re going to pass them to WebGPU you need to make sure they’re loaded.
   const img = new Image();
   img.src = 'someUrl';
   device.write.copyExternalImageToTexture({ source: img }, ...); // ERROR!
The code above will fail because img has not loaded yet.
How you wait is up to you. One example:
   const img = new Image();
   img.src = 'someUrl';
   await img.decode();
   device.write.copyExternalImageToTexture({ source: img }, ...);