WebGPU Compute Shaders - Image Histogram
This article continues from the article on compute shader basics.
This is going to be a long 2 part article and we’re going to take many steps to optimize things. This optimization will make things faster but the output will unfortunately not change the result so each step will look the same as the previous step.
Further, we’re going to mention speed and timing but the articles and examples would get even longer if we added the code to do the timing so we’ll leave timing to another article and in these articles I’ll just mention my own timing and provide some run-able examples. Hopefully this article will provide one example of making a compute shader.
An image histogram is where you sum up all the pixels in an image by their values or by some measure of their values.
For example, this 6x7 image
It has these colors.
For each color we can compute a luminance level, (how bright it is). Looking online I found this formula
// Returns a value from 0 to 1 for luminance.
// where r, g, b each go from 0 to 1.
function srgbLuminance(r, g, b) {
  // from: https://www.w3.org/WAI/GL/wiki/Relative_luminance
  return r * 0.2126 +
         g * 0.7152 +
         b * 0.0722;
}
Using that we can convert each value to a luminance level
We can decide on a number “bins”. Let’s decide on 3 bins. We can then quantize those luminance values so they select a “bin” and add up the number of pixels that fit in each bin.
Finally we can graph the values in those bins
The graph shows that there are more dark pixels (🟦 18) than medium brightness pixels (🟥 16) and even fewer bright pixels (🟨 8). That’s not so interesting with just 3 bins. But, if we take a picture like this

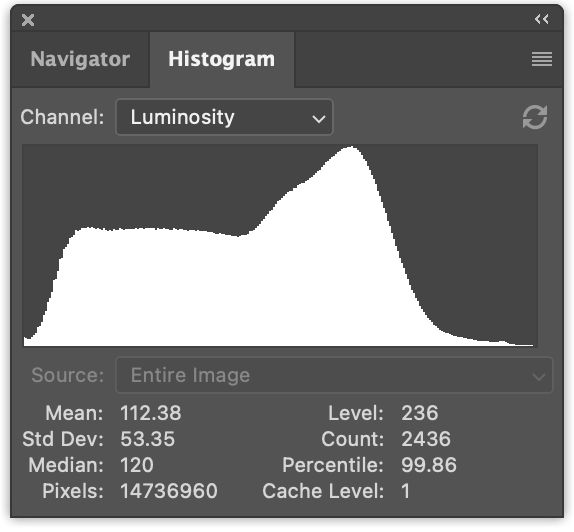
and we count up the pixel luminance values, separate them into say 256 bins, and graph them, we get something like this
Computing an image histogram is pretty simple. Let’s first do it in JavaScript
Let’s make a function that given an ImageData object, generates
a histogram.
function computeHistogram(numBins, imgData) {
  const {width, height, data} = imgData;
  const bins = new Array(numBins).fill(0);
  for (let y = 0; y < height; ++y) {
    for (let x = 0; x < width; ++x) {
      const offset = (y * width + x) * 4;

      const r = data[offset + 0] / 255;
      const g = data[offset + 1] / 255;
      const b = data[offset + 2] / 255;
      const v = srgbLuminance(r, g, b);

      const bin = Math.min(numBins - 1, v * numBins) | 0;
      ++bins[bin];
    }
  }
  return bins;
}
As you can see above, we walk through each pixel. We extract r, g, and b from the image. We compute a luminance value. We convert that to a bin index and increment that bin’s count.
Once we have that data we can graph it. The main graph function just draws a line for each bin multiplied by some scale and the height of the canvas.
  ctx.fillStyle = '#fff';

  for (let x = 0; x < numBins; ++x) {
    const v = histogram[x] * scale * height;
    ctx.fillRect(x, height - v, 1, v);
  }
Deciding on a scale appears to be just a personal choice. If you know of a good formula for choosing a scale leave a comment. 😅 Based on looking around the net I came up with this formula for scale.
  const numBins = histogram.length;
  const max = Math.max(...histogram);
  const scale = Math.max(1 / max, 0.2 * numBins / numEntries);
Where numEntries is the total number of pixels in the image (ie, width * height),
and basically we’re trying to scale so the bin with the most values touches the
top of the graph but, if that bin is too large then we have some ratio that appears
to produce a pleasant graph.
Putting it all together we create a 2D canvas and draw
function drawHistogram(histogram, numEntries, height = 100) {
  const numBins = histogram.length;
  const max = Math.max(...histogram);
  const scale = Math.max(1 / max, 0.2 * numBins / numEntries);

  const canvas = document.createElement('canvas');
  canvas.width = numBins;
  canvas.height = height;
  document.body.appendChild(canvas);
  const ctx = canvas.getContext('2d');

  ctx.fillStyle = '#fff';

  for (let x = 0; x < numBins; ++x) {
    const v = histogram[x] * scale * height;
    ctx.fillRect(x, height - v, 1, v);
  }
}
Now we need to load an image. We’ll use the code we wrote in the article on loading images.
async function main() {
  const imgBitmap = await loadImageBitmap('resources/images/pexels-francesco-ungaro-96938-mid.jpg');
We need get the data from an image. To do that we can draw the image
to a 2d canvas and then use getImageData.
function getImageData(img) {
  const canvas = document.createElement('canvas');

  // make the canvas the same size as the image
  canvas.width = img.naturalWidth;
  canvas.height = img.naturalHeight;

  const ctx = canvas.getContext('2d');
  ctx.drawImage(img, 0, 0);
  return ctx.getImageData(0, 0, canvas.width, canvas.height);
}
We’ll also write a function to display an ImageBitmap
function showImageBitmap(imageBitmap) {
  const canvas = document.createElement('canvas');
  canvas.width = imageBitmap.width;
  canvas.height = imageBitmap.height;

  const bm = canvas.getContext('bitmaprenderer');
  bm.transferFromImageBitmap(imageBitmap);
  document.body.appendChild(canvas);
}
Let’s add some CSS so our image is not displayed too big and give it a background color so we don’t have to draw one.
canvas {
  display: block;
  max-width: 256px;
  border: 1px solid #888;
  background-color: #333;
}
And then we just need call the functions we wrote above.
async function main() {
  const imgBitmap = await loadImageBitmap('resources/images/pexels-francesco-ungaro-96938-mid.jpg');

  const imgData = getImageData(imgBitmap);
  const numBins = 256;
  const histogram = computeHistogram(numBins, imgData);

  showImageBitmap(imgBitmap);

  const numEntries = imgData.width * imgData.height;
  drawHistogram(histogram, numEntries);
}
And here’s the image histogram.
Hopefully it was easy to follow what the JavaScript code is doing. Let’s convert it to WebGPU!
Computing a histogram on the GPU
Let’s start with the most obvious solution. We’ll directly
convert the JavaScript computeHistogram function to WGSL.
The luminance function is pretty straight forward. Here the JavaScript again
// Returns a value from 0 to 1 for luminance.
// where r, g, b each go from 0 to 1.
function srgbLuminance(r, g, b) {
  // from: https://www.w3.org/WAI/GL/wiki/Relative_luminance
  return r * 0.2126 +
         g * 0.7152 +
         b * 0.0722;
}
and here’s the corresponding WGSL
// from: https://www.w3.org/WAI/GL/wiki/Relative_luminance
const kSRGBLuminanceFactors = vec3f(0.2126, 0.7152, 0.0722);
fn srgbLuminance(color: vec3f) -> f32 {
  return saturate(dot(color, kSRGBLuminanceFactors));
}
The dot function, which is short for “dot product”, multiplies every element
of one vector with the corresponding element of another vector and then adds
the results. For vec3f like above, it could be defined as
fn dot(a: vec3f, b: vec3f) -> f32 {
  return a.x * b.x + a.y * b.y + a.z * b.z;
}
Which is what we had in JavaScript. The major difference is in WGSL we’ll
pass in the color as a vec3f instead of the individual channels.
For the main part of computing a histogram, here’s the JavaScript again
function computeHistogram(numBins, imgData) {
  const {width, height, data} = imgData;
  const bins = new Array(numBins).fill(0);
  for (let y = 0; y < height; ++y) {
    for (let x = 0; x < width; ++x) {
      const offset = (y * width + x) * 4;

      const r = data[offset + 0] / 255;
      const g = data[offset + 1] / 255;
      const b = data[offset + 2] / 255;
      const v = srgbLuminance(r, g, b);

      const bin = Math.min(numBins - 1, v * numBins) | 0;
      ++bins[bin];
    }
  }
  return bins;
}
Here’s the corresponding WGSL
@group(0) @binding(0) var<storage, read_write> bins: array<u32>;
@group(0) @binding(1) var ourTexture: texture_2d<f32>;

// from: https://www.w3.org/WAI/GL/wiki/Relative_luminance
const kSRGBLuminanceFactors = vec3f(0.2126, 0.7152, 0.0722);
fn srgbLuminance(color: vec3f) -> f32 {
  return saturate(dot(color, kSRGBLuminanceFactors));
}

@compute @workgroup_size(1) fn cs() {
  let size = textureDimensions(ourTexture, 0);
  let numBins = f32(arrayLength(&bins));
  let lastBinIndex = u32(numBins - 1);
  for (var y = 0u; y < size.y; y++) {
    for (var x = 0u; x < size.x; x++) {
      let position = vec2u(x, y);
      let color = textureLoad(ourTexture, position, 0);
      let v = srgbLuminance(color.rgb);
      let bin = min(u32(v * numBins), lastBinIndex);
      bins[bin] += 1;
    }
  }
}
Above, not much changed. In JavaScript we get the data, width, and height
from imgData. In WGSL we get the width and height from the texture by
passing it to the textureDimensions function.
let size = textureDimensions(ourTexture, 0);
textureDimensions takes a texture and a mip level (the 0 above) and returns the
size of the mip level for that texture.
We loop through all of the pixels of the texture, just like we did in JavaScript.
  for (var y = 0u; y < size.y; y++) {
    for (var x = 0u; x < size.x; x++) {
We call textureLoad to get the color from the texture.
      let position = vec2u(x, y);
      let color = textureLoad(ourTexture, position, 0);
textureLoad returns a single texel from a single mip level of a texture.
It takes a texture, an vec2u texel position, and a mip level
(the 0).
We compute a luminance value, convert it to a bin index and increment that bin.
      let position = vec2u(x, y);
      let color = textureLoad(ourTexture, position, 0);
+      let v = srgbLuminance(color.rgb);
+      let bin = min(u32(v * numBins), lastBinIndex);
+      bins[bin] += 1;
Now the we have a compute shader, let’s use it
We have our pretty standard initialization code
async function main() {
  const adapter = await navigator.gpu?.requestAdapter();
  const device = await adapter?.requestDevice();
  if (!device) {
    fail('need a browser that supports WebGPU');
    return;
  }
then we create our shader
  const module = device.createShaderModule({
    label: 'histogram shader',
    code: /* wgsl */ `
      @group(0) @binding(0) var<storage, read_write> bins: array<u32>;
      @group(0) @binding(1) var ourTexture: texture_2d<f32>;

      // from: https://www.w3.org/WAI/GL/wiki/Relative_luminance
      const kSRGBLuminanceFactors = vec3f(0.2126, 0.7152, 0.0722);
      fn srgbLuminance(color: vec3f) -> f32 {
        return saturate(dot(color, kSRGBLuminanceFactors));
      }

      @compute @workgroup_size(1) fn cs() {
        let size = textureDimensions(ourTexture, 0);
        let numBins = f32(arrayLength(&bins));
        let lastBinIndex = u32(numBins - 1);
        for (var y = 0u; y < size.y; y++) {
          for (var x = 0u; x < size.x; x++) {
            let position = vec2u(x, y);
            let color = textureLoad(ourTexture, position, 0);
            let v = srgbLuminance(color.rgb);
            let bin = min(u32(v * numBins), lastBinIndex);
            bins[bin] += 1;
          }
        }
      }
    `,
  });
We create a compute pipeline to run the shader
  const pipeline = device.createComputePipeline({
    label: 'histogram',
    layout: 'auto',
    compute: {
      module,
    },
  });
After we load the image we need to make a texture and copy the data to it.
We’ll use the createTextureFromSource function we wrote in
the article on loading images into textures.
  const imgBitmap = await loadImageBitmap('resources/images/pexels-francesco-ungaro-96938-mid.jpg');
  const texture = createTextureFromSource(device, imgBitmap);
We need to create a storage buffer for the shader to sum up the color values with
  const numBins = 256;
  const histogramBuffer = device.createBuffer({
    size: numBins * 4, // 256 entries * 4 bytes per (u32)
    usage: GPUBufferUsage.STORAGE | GPUBufferUsage.COPY_SRC,
  });
and a buffer to get back the results so we can draw them
  const resultBuffer = device.createBuffer({
    size: histogramBuffer.size,
    usage: GPUBufferUsage.COPY_DST | GPUBufferUsage.MAP_READ,
  });
We need a bind group to pass the texture and histogram buffer to our pipeline
  const bindGroup = device.createBindGroup({
    label: 'histogram bindGroup',
    layout: pipeline.getBindGroupLayout(0),
    entries: [
      { binding: 0, resource: histogramBuffer },
      { binding: 1, resource: texture },
    ],
  });
We can now setup the commands to run the compute shader
  const encoder = device.createCommandEncoder({ label: 'histogram encoder' });
  const pass = encoder.beginComputePass();
  pass.setPipeline(pipeline);
  pass.setBindGroup(0, bindGroup);
  pass.dispatchWorkgroups(1);
  pass.end();
We need to copy the histogram buffer to the result buffer
  const encoder = device.createCommandEncoder({ label: 'histogram encoder' });
  const pass = encoder.beginComputePass();
  pass.setPipeline(pipeline);
  pass.setBindGroup(0, bindGroup);
  pass.dispatchWorkgroups(1);
  pass.end();

+  encoder.copyBufferToBuffer(histogramBuffer, 0, resultBuffer, 0, resultBuffer.size);
and then execute the commands
  const encoder = device.createCommandEncoder({ label: 'histogram encoder' });
  const pass = encoder.beginComputePass();
  pass.setPipeline(pipeline);
  pass.setBindGroup(0, bindGroup);
  pass.dispatchWorkgroups(1);
  pass.end();

  encoder.copyBufferToBuffer(histogramBuffer, 0, resultBuffer, 0, resultBuffer.size);

+  const commandBuffer = encoder.finish();
+  device.queue.submit([commandBuffer]);
Finally we can get the data from the result buffer and pass it to our existing functions to draw the histogram
  await resultBuffer.mapAsync(GPUMapMode.READ);
  const histogram = new Uint32Array(resultBuffer.getMappedRange());

  showImageBitmap(imgBitmap);

  const numEntries = texture.width * texture.height;
  drawHistogram(histogram, numEntries);

  resultBuffer.unmap();
And it should work
Timing the results I found this is about 30x slower than the JavaScript version!!! 😱😱😱 (YMMV).
What’s up with that? We designed our solution above with a single loop and used a single workgroup invocation with a size of 1. That means just a single “core” of the GPU was used to compute the histogram. GPU cores are generally not as fast as CPU cores. CPU cores have tons of extra circuitry to try to speed them up. GPUs get their speed from massive parallelization but need to keep their design simpler. Given our shader above we didn’t take advantage of any parallelization.
Here’s a diagram of what’s happening using our small example texture.
Diagram vs Shader Differences
These diagrams are not a perfect representation of our shaders
- They show only 3 bins where as our shader has 256 bins
- The code is simplified.
- ▢ is the texel color
- ◯ is the bin selection represented as luminance
- Many things are abbreviated.
wid=workgroup_idgid=global_invocation_idlid=local_invocation_idourTex=ourTexturetexLoad=textureLoad- etc…
Many of these changes are because there is only so much room to try to display many details. While this first example uses a single invocation, as we progress we’ll need to cram more info in less space. I hope the diagrams aid in understanding rather than make things more confusing. 😅
Given a single GPU invocation is slower than a CPU we need to find a way to parallelize our approach.
Optimize - More Invocations
Possibly the easiest and most obvious way to speed this up use to use one workgroup per pixel. In our code above we have for loop
for (y) {
   for (x) {
      ...
   }
}
We could change the code use instead use global_invocation_id
as an input and then process every single pixel in a separate invocation.
Here’s the needed changes to the shader
@group(0) @binding(0) var<storage, read_write> bins: array<vec4u>;
@group(0) @binding(1) var ourTexture: texture_2d<f32>;

// from: https://www.w3.org/WAI/GL/wiki/Relative_luminance
const kSRGBLuminanceFactors = vec3f(0.2126, 0.7152, 0.0722);
fn srgbLuminance(color: vec3f) -> f32 {
  return saturate(dot(color, kSRGBLuminanceFactors));
}

@compute @workgroup_size(1, 1, 1)
-fn cs() {
+fn cs(@builtin(global_invocation_id) global_invocation_id: vec3u) {
-  let size = textureDimensions(ourTexture, 0);
  let numBins = f32(arrayLength(&bins));
  let lastBinIndex = u32(numBins - 1);
-  for (var y = 0u; y < size.y; y++) {
-    for (var x = 0u; x < size.x; x++) {
-      let position = vec2u(x, y);
+  let position = global_invocation_id.xy;
  let color = textureLoad(ourTexture, position, 0);
  let v = srgbLuminance(color.rgb);
  let bin = min(u32(v * numBins), lastBinIndex);
  bins[bin] += 1;
-    }
-  }
}
As you can see, we got rid of the loop, instead we use the
@builtin(global_invocation_id) value to make each workgroup
responsible for a single pixel. Theoretically this would mean
all of the pixels could be processed in parallel.
Our image is 2448 × 1505 which is almost 3.7 million pixels so
there are lots of chances for parallelization.
The only other change needed is to actually run one workgroup per pixel.
  const encoder = device.createCommandEncoder({ label: 'histogram encoder' });
  const pass = encoder.beginComputePass();
  pass.setPipeline(pipeline);
  pass.setBindGroup(0, bindGroup);
-  pass.dispatchWorkgroups(1);
+  pass.dispatchWorkgroups(texture.width, texture.height);
  pass.end();
Here it is running
What’s wrong? Why doesn’t this histogram match the previous histogram and why don’t the totals match? Note: your computer might get different results than mine. On mine, this is the histogram from the previous version on the top, and then 4 results from the new version on the bottom.
Our new version gets inconsistent results (at least on my machine).
What happened?
This is a classic race condition like we mentioned in the previous article.
This line in our shader
bins[bin] += 1;
Actually translates to this
   let value = bins[bin];
   value = value + 1
   bins[bin] = value;
What happens when 2 or more invocations are running in parallel
and happen to have the same bin value?
Imagine 2 invocations, where bin = 1 and
bins[1] = 3. If they run in parallel both invocations will load
3 and both invocations will write 4, when the correct answer would be
5.
| Invocation 1 | Invocation 2 |
|---|---|
| value = bins[bin] // loads 3 | value = bins[bin] // loads 3 |
| value = value + 1 // adds 1 | value = value + 1 // adds 1 |
| bins[bin] = value // stores 4 | bins[bin] = value // stores 4 |
You can see the problem visually in the diagram below. You’ll see several invocations go and fetch the current value in the bin, add one to it, and put it back, each of oblivious that another invocation is reading and updating the same bin at the same time.
WGSL has special “atomic” instructions to solve this issue. This case we
can use atomicAdd. atomicAdd makes the addition “atomic” which
means rather than 3 operations, load->add->store, all 3 operations
happen at once, “atomically”. This effectively prevents more than
two invocations from updating a value at the same time.
Atomic functions have the requirement that they only work on
i32 or u32 and they require to data itself to be of type atomic.
Here’s the changes to our shaders
-@group(0) @binding(0) var<storage, read_write> bins: array<u32>;
+@group(0) @binding(0) var<storage, read_write> bins: array<atomic<u32>>;
@group(0) @binding(1) var ourTexture: texture_2d<f32>;

const kSRGBLuminanceFactors = vec3f(0.2126, 0.7152, 0.0722);
fn srgbLuminance(color: vec3f) -> f32 {
  return saturate(dot(color, kSRGBLuminanceFactors));
}

@compute @workgroup_size(1, 1, 1)
fn cs(@builtin(global_invocation_id) global_invocation_id: vec3u) {
  let numBins = f32(arrayLength(&bins));
  let lastBinIndex = u32(numBins - 1);
  let position = global_invocation_id.xy;
  let color = textureLoad(ourTexture, position, 0);
  let v = srgbLuminance(color.rgb);
  let bin = min(u32(v * numBins), lastBinIndex);
-  bins[bin] += 1;
+  atomicAdd(&bins[bin], 1u);
}
With that our compute shader, that uses 1 workgroup invocation per pixel, works!
Unfortunately we have a new problem. atomicAdd effectively needs to block
other invocations from updating the same bin at the same time. We can see
the issue here. The diagram below shows atomicAdd as 3 operations
but when an invocation is doing an atomicAdd it “locks the bin”
so that another invocation has to wait until it’s done.
In the diagrams, when an invocation is locking a bin it will have a line from the invocation to the bin in the color of the bin. Invocations that are waiting for that bin to unlock will have a stop sign 🛑 on them.
On my machine, this new version runs at around 4x faster than JavaScript though YMMV.
Workgroups
Can we go faster? As mentioned in the previous article,
the “workgroup” is the smallest unit of work we can ask the GPU can do. You define the size
of a workgroup in 3 dimensions when you create the shader module,
and then you call dispatchWorkgroups to run a bunch of these workgroups.
Workgroups can share internal storage and coordinate that storage with in the workgroup itself. How could we take advantage of that fact?
Let’s try this. We’ll make our workgroup size, 256x1 (so 256 invocations per workgroup).
We’ll have each invocation work on a 256x1 section of the image. This will mean
we will have Math.ceil(texture.width / 256) * texture.height total workgroups.
For our image, which is 2448 × 1505, that would be 10 x 1505 or 15050 workgroups.
We’ll have the invocations within the workgroup use workgroup storage to sum up the luminance values into bins.
Finally we’ll copy the workgroup memory for the workgroup into its own “chunk”. That way we will not have to coordinate with other workgroups. When were done, we’ll run another compute shader to sum up the chunks.
Let’s edit our shader. First we’ll change our bins from type storage to
type workgroup so they’ll only be shared with invocations in the same workgroup.
-@group(0) @binding(0) var<storage, read_write> bins: array<atomic<u32>>;
+const chunkWidth = 256;
+const chunkHeight = 1;
+const chunkSize = chunkWidth * chunkHeight;
+var<workgroup> bins: array<atomic<u32>, chunkSize>;
Above we declared some constants so we can easily change them.
Then we need storage for all of our chunks
+@group(0) @binding(0) var<storage, read_write> chunks: array<array<u32, chunkSize>>;
@group(0) @binding(1) var ourTexture: texture_2d<f32>;

const kSRGBLuminanceFactors = vec3f(0.2126, 0.7152, 0.0722);
fn srgbLuminance(color: vec3f) -> f32 {
  return saturate(dot(color, kSRGBLuminanceFactors));
}
We can use the constants to define our workgroup size
-@compute @workgroup_size(1, 1, 1)
+@compute @workgroup_size(chunkWidth, chunkHeight, 1)
The main part that increments the bins is very similar to our previous shader.
fn cs(@builtin(global_invocation_id) global_invocation_id: vec3u) {
  let size = textureDimensions(ourTexture, 0);
  let position = global_invocation_id.xy;
+  if (all(position < size)) {
-    let numBins = f32(arrayLength(&bins));
+    let numBins = f32(chunkSize);
    let lastBinIndex = u32(numBins - 1);
    let color = textureLoad(ourTexture, position, 0);
    let v = srgbLuminance(color.rgb);
    let bin = min(u32(v * numBins), lastBinIndex);
    atomicAdd(&bins[bin], 1u);
  }
Because our chunk size is hardcoded into the shader we don’t want to work on
pixels outside of our texture. So for example if our image was 300 pixels
wide, the first workgroup would work on pixels 0 to 255. The second workgroup
would work on pixels 256 to 511. But we only need work up to pixel 299.
This is what the if(all(position < size)) does. Both position and size are
vec2u and so position < size will produce 2 boolean values which is avec2<bool>.
the all function returns true if all of its inputs are true. So, the code
will only go inside the if if position.x < size.x and position.y < size.y.
As for numBins, we have as many bins as we defined for the chunk size.
We can no longer lookup the size because we don’t pass in a buffer for
var<workgroup> like we did for var<storage>. Its size is defined when
we create the shader module.
Finally the most different part of the shader.
  workgroupBarrier();

  let chunksAcross = (size.x + chunkWidth - 1) / chunkWidth;
  let chunkDim = vec2u(chunkWidth, chunkHeight);
  let chunkPos = global_invocation_id.xy / chunkDim;
  let chunk = chunkPos.y * chunksAcross + chunkPos.x;
  let binPos = global_invocation_id.xy % chunkDim;
  let bin = binPos.y * chunkWidth + binPos.x;

  chunks[chunk][bin] = atomicLoad(&bins[bin]);
}
This part just has each invocation copy one bin to the corresponding bin
of a specific chunk, the chunk being worked on by this workgroup.
Some of the calculations where are to convert global_invocation_id
into both a chunkPos and a binPos. Those values are effectively
the workgroup_id and local_invocation_id so we could simplify
this code to
  workgroupBarrier();

  let chunksAcross = (size.x + chunkWidth - 1) / chunkWidth;
  let chunk = workgroup_id.y * chunksAcross + workgroup_id.x;
  let bin = local_invocation_id.y * chunkWidth + local_invocation_id.x;

  chunks[chunk][bin] = atomicLoad(&bins[bin]);
}
We’d then need to add workgroup_id and local_invocation_id as inputs
to the shader function
-fn cs(@builtin(global_invocation_id) global_invocation_id: vec3u) {
+fn cs(
+  @builtin(global_invocation_id) global_invocation_id: vec3u,
+  @builtin(workgroup_id) workgroup_id: vec3u,
+  @builtin(local_invocation_id) local_invocation_id: vec3u,
+) {

  ...
workgroupBarrier
The workgroupBarrier() effectively says "stop here until all invocations
in this workgroup reach this point. We need this because each invocation
is updating different elements in bins but afterward, each invocation
will copy just one element from bins to the correspond element in
one of the chunks so we need to make sure all other invocations are done.
To say this another way, any invocation can atomicAdd any element in bins
depending on what color it reads from the texture. But, only
local_invocation_id = 3,0 will copy bin[3] to chunks[chunk][3] so it
has to wait for all other invocations to have their chance to update bin[3].
Putting it all together here is our new shader
const chunkWidth = 256;
const chunkHeight = 1;
const chunkSize = chunkWidth * chunkHeight;
var<workgroup> bins: array<atomic<u32>, chunkSize>;
@group(0) @binding(0) var<storage, read_write> chunks: array<array<u32, chunkSize>>;
@group(0) @binding(1) var ourTexture: texture_2d<f32>;

const kSRGBLuminanceFactors = vec3f(0.2126, 0.7152, 0.0722);
fn srgbLuminance(color: vec3f) -> f32 {
  return saturate(dot(color, kSRGBLuminanceFactors));
}

@compute @workgroup_size(chunkWidth, chunkHeight, 1)
fn cs(
  @builtin(global_invocation_id) global_invocation_id: vec3u,
  @builtin(workgroup_id) workgroup_id: vec3u,
  @builtin(local_invocation_id) local_invocation_id: vec3u,
) {
  let size = textureDimensions(ourTexture, 0);
  let position = global_invocation_id.xy;
  if (all(position < size)) {
    let numBins = f32(chunkSize);
    let lastBinIndex = u32(numBins - 1);
    let color = textureLoad(ourTexture, position, 0);
    let v = srgbLuminance(color.rgb);
    let bin = min(u32(v * numBins), lastBinIndex);
    atomicAdd(&bins[bin], 1u);
  }

  workgroupBarrier();

  let chunksAcross = (size.x + chunkWidth - 1) / chunkWidth;
  let chunk = workgroup_id.y * chunksAcross + workgroup_id.x;
  let bin = local_invocation_id.y * chunkWidth + local_invocation_id.x;

  chunks[chunk][bin] = atomicLoad(&bins[bin]);
}
One more thing we could do, rather than hardcode chunkWidth and chunkHeight
we could pass them in from JavaScript like this
+  const k = {
+    chunkWidth: 256,
+    chunkHeight: 1,
+  };
+  const sharedConstants = Object.entries(k)
+    .map(([k, v]) => `const ${k} = ${v};`)
+    .join('\n');

  const histogramChunkModule = device.createShaderModule({
    label: 'histogram chunk shader',
    code: /* wgsl */ `
-      const chunkWidth = 256;
-      const chunkHeight = 1;
+      ${sharedConstants}
      const chunkSize = chunkWidth * chunkHeight;
      var<workgroup> bins: array<atomic<u32>, chunkSize>;
      @group(0) @binding(0) var<storage, read_write> chunks: array<array<u32, chunkSize>>;
      @group(0) @binding(1) var ourTexture: texture_2d<f32>;

      ...
    `,
  });
If we ran this shader it would work something like this:
Above you can see, each workgroup reads one chunk’s worth of pixels and updates
the bins accordingly. Just like before, if 2 invocations need to update the same
bin one of them will have to wait 🛑. Afterwords they all wait for each other at
the workgroupBarrier 🚧. After that each invocation copies the bin it’s
responsible for to the corresponding bin in the chunk it’s working on.
Summing the chunks
All the pixel luminance values have now been counted but we need to sum up the bins to get the answer. Let’s write a compute shader to do that. We can do one invocation per bin. Each invocation will just add up all of the values from the same bin in each chunk and then write the result to the first chunk
Here’s the code
const chunkWidth = 256;
const chunkHeight = 1;
const chunkSize = chunkWidth * chunkHeight;
@group(0) @binding(0) var<storage, read_write> chunks: array<array<u32, chunkSize>>;

@compute @workgroup_size(chunkSize, 1, 1)
fn cs(@builtin(local_invocation_id) local_invocation_id: vec3u) {
  var sum = u32(0);
  let numChunks = arrayLength(&chunks);
  for (var i = 0u; i < numChunks; i++) {
    sum += chunks[i][local_invocation_id.x];
  }
  chunks[0][local_invocation_id.x] = sum;
}
And, like before, we can inject the chunkWidth and chunkHeight.
const chunkSumModule = device.createShaderModule({
  label: 'chunk sum shader',
  code: /* wgsl */ `
*    ${sharedConstants}
    const chunkSize = chunkWidth * chunkHeight;
    @group(0) @binding(0) var<storage, read_write> chunks: array<array<u32, chunkSize>>;

    @compute @workgroup_size(chunkSize, 1, 1)

    ...
    }
  `,
});
This shader will effectively work like this
Now that we have these 2 shaders, let’s update the code to use them. We need to create pipelines for both shaders
-  const pipeline = device.createComputePipeline({
-    label: 'histogram',
-    layout: 'auto',
-    compute: {
-      module,
--    },
-  });

+  const histogramChunkPipeline = device.createComputePipeline({
+    label: 'histogram',
+    layout: 'auto',
+    compute: {
+      module: histogramChunkModule,
++    },
+  });
+
+  const chunkSumPipeline = device.createComputePipeline({
+    label: 'chunk sum',
+    layout: 'auto',
+    compute: {
+      module: chunkSumModule,
++    },
+  });
We need to create a storage buffer large enough for all our chunks so we compute how many chunks we need to cover the entire image.
  const imgBitmap = await loadImageBitmap('resources/images/pexels-francesco-ungaro-96938-mid.jpg');
  const texture = createTextureFromSource(device, imgBitmap);

-  const numBins = 256;
-  const histogramBuffer = device.createBuffer({
-    size: numBins * 4, // 256 entries * 4 bytes per (u32)
-    usage: GPUBufferUsage.STORAGE | GPUBufferUsage.COPY_SRC,
-  });
+  const chunkSize = k.chunkWidth * k.chunkHeight;
+  const chunksAcross = Math.ceil(texture.width / k.chunkWidth);
+  const chunksDown = Math.ceil(texture.height / k.chunkHeight);
+  const numChunks = chunksAcross * chunksDown;
+  const chunksBuffer = device.createBuffer({
+    size: numChunks * chunkSize * 4, // 4 bytes per (u32)
+    usage: GPUBufferUsage.STORAGE | GPUBufferUsage.COPY_SRC,
+  });
We still need our result buffer to read the result but it’s no longer the same size as the previous buffer
  const resultBuffer = device.createBuffer({
-    size: histogramBuffer.size,
+    size: chunkSize * 4,  // 4 bytes per (u32)
    usage: GPUBufferUsage.COPY_DST | GPUBufferUsage.MAP_READ,
  });
We need a bindGroup for each pass. One to pass the texture and chunks to the first shader and another to pass the chunks to the second shader
-  const bindGroup = device.createBindGroup({
+  const histogramBindGroup = device.createBindGroup({
    label: 'histogram bindGroup',
    layout: histogramChunkPipeline.getBindGroupLayout(0),
    entries: [
-      { binding: 0, resource: histogramBuffer },
+      { binding: 0, resource: chunksBuffer },
      { binding: 1, resource: texture },
    ],
  });

  const chunkSumBindGroup = device.createBindGroup({
    label: 'sum bindGroup',
    layout: chunkSumPipeline.getBindGroupLayout(0),
    entries: [
      { binding: 0, resource: chunksBuffer },
    ],
  });
Finally we can run our shaders. First, the part that reads the pixels and sorts them into bins, we dispatch one workgroup for each chunk.
  const encoder = device.createCommandEncoder({ label: 'histogram encoder' });
  const pass = encoder.beginComputePass();

+  // create a histogram for each area
-  pass.setPipeline(pipeline);
-  pass.setBindGroup(0, bindGroup);
-  pass.dispatchWorkgroups(texture.width, texture.height);
+  pass.setPipeline(histogramChunkPipeline);
+  pass.setBindGroup(0, histogramBindGroup);
+  pass.dispatchWorkgroups(chunksAcross, chunksDown);
Then we need to run the shader that sums up the chunks. It’s just 1 workgroup which uses 1 invocation per bin (256 invocations).
+  // sum the areas
+  pass.setPipeline(chunkSumPipeline);
+  pass.setBindGroup(0, chunkSumBindGroup);
+  pass.dispatchWorkgroups(1);
The rest of the code is the same.
Timing this on my machine I was happy to see the first shader runs in 0.2ms! It read the entire image and filled out all the chunks lickety-split!
Unfortunately the part that sums up the chunks took much longer. 11ms That’s SLOWER than our previous shader!
On a different machine the previous solution was was 4.4ms and this new was 1.7ms so it wasn’t a complete loss.
Can we do better?
Reduce
The solution above used a single workgroup. Even though it has 256 invocations a modern GPU has 1000s of cores and we’re only use 256 of them.
One technique we could try is sometimes called reducing. We will have each workgroup only add 2 chunks, writing the result to the first of those 2 chunks. This way, if we have 1000 chunks we can use 500 workgroups. That’s far more parallelization. We’ll repeat the process 500 chunks reduced into 250, 250 -> 125, 125 -> 63 etc… until we’ve reduced to 1 chunk.
We can use just one shader and we just have to pass in a stride to reduce the chunks down to one chunk. The stride is the number of chunks we need to advance to get to the second chunk we’re summing with. If we pass in a stride of 1 then we’ll sum adjacent chunks. If we pass in a stride of 2 then we sum every other chunk. etc…
Here are the changes to our shader
const chunkSumModule = device.createShaderModule({
  label: 'chunk sum shader',
  code: /* wgsl */ `
    ${sharedConstants}
    const chunkSize = chunkWidth * chunkHeight;

+    struct Uniforms {
+      stride: u32,
+    };

    @group(0) @binding(0) var<storage, read_write> chunks: array<array<vec4u, chunkSize>>;
+    @group(0) @binding(1) var<uniform> uni: Uniforms;

    @compute @workgroup_size(chunkSize, 1, 1) fn cs(
      @builtin(local_invocation_id) local_invocation_id: vec3u,
      @builtin(workgroup_id) workgroup_id: vec3u,
    ) {
-      var sum = u32(0);
-      let numChunks = arrayLength(&chunks);
-      for (var i = 0u; i < numChunks; i++) {
-        sum += chunks[i][local_invocation_id.x];
-      }
-      chunks[0][local_invocation_id.x] = sum;
+      let chunk0 = workgroup_id.x * uni.stride * 2;
+      let chunk1 = chunk0 + uni.stride;
+
+      let sum = chunks[chunk0][local_invocation_id.x] +
+                chunks[chunk1][local_invocation_id.x];
+      chunks[chunk0][local_invocation_id.x] = sum;
    }
  `,
});
You can see above, we compute a chunk0 and chunk1 based on the workgroup_id.x
and uni.stride that we pass in as a uniform. We then just add the 2 bins from
the 2 chunks and store them back the first.
If we run it with the correct number of invocations and stride settings it will operate something like this. Note: the darkened chunks are chunks that are no longer used.
To make this new one work we need to add a uniform buffer for each stride value as well as a bindGroup.
const sumBindGroups = [];
const numSteps = Math.ceil(Math.log2(numChunks));
for (let i = 0; i < numSteps; ++i) {
  const stride = 2 ** i;
  const uniformBuffer = device.createBuffer({
    size: 4,
    usage: GPUBufferUsage.UNIFORM,
    mappedAtCreation: true,
  });
  new Uint32Array(uniformBuffer.getMappedRange()).set([stride]);
  uniformBuffer.unmap();

  const chunkSumBindGroup = device.createBindGroup({
    layout: chunkSumPipeline.getBindGroupLayout(0),
    entries: [
      { binding: 0, resource: chunksBuffer },
      { binding: 1, resource: uniformBuffer },
    ],
  });
  sumBindGroups.push(chunkSumBindGroup);
}
Then we just need to call these with the correct number of dispatches until we’ve reduced things to 1 chunk
-  // sum the areas
-  pass.setPipeline(chunkSumPipeline);
-  pass.setBindGroup(0, chunkSumBindGroup);
-  pass.dispatchWorkgroups(1);
+  // reduce the chunks
+  const pass = encoder.beginComputePass();
+  pass.setPipeline(chunkSumPipeline);
+  let chunksLeft = numChunks;
+  sumBindGroups.forEach(bindGroup => {
+    pass.setBindGroup(0, bindGroup);
+    const dispatchCount = Math.floor(chunksLeft / 2);
+    chunksLeft -= dispatchCount;
+    pass.dispatchWorkgroups(dispatchCount);
+  });
Timing this version I got under 1ms on both machines I tested! 🎉🚀
Here are some timings from various machines
There may be a faster way to compute a histogram. It might also be better to try different chunk sizes. Maybe 16x16 is better than 256x1. Also, at some point WebGPU will likely support subgroups which is yet another whole topic and an area for even more optimization.
For now I hope these examples have given you some ideas on how to write and optimize a compute shader. The takeaways are:
-
Find a way to use all of the parallelization the GPU provides
-
Be aware of race conditions
-
Use
var<workgroup>to create storage shared between all invocations of a workgroup -
Try to design algorithms that require less coordination between invocations.
-
When coordination is required, atomic operations can be a solution as well as
workgroupBarrier.We did so-so on this front. When computing our chunks in workgroup memory we still have conflicts which we resolved via
atomicAddbut we have no conflicts when copying from thebinsin the workgroup into thechunksand we have no conflicts when we reduce thechunksto one final result
Maybe one more
-
Don’t assume the GPU is fast.
We learned individual cores of a GPU are not so fast. All the speed comes from parallelization so we need to design parallel solutions.
In the next article we’ll tweak these a little as well as change it so we graph the results using the GPU instead of pulling them back to JavaScript. We’ll also try some real time video adjustments based on having created an image histogram.